In economics, the formula is simple:
Demand – Supply = Price.
So why is predicting freight rates still so difficult?
The freight market is notorious for volatility. One year, capacity is tight and rates skyrocket. The next, trucks sit idle and margins shrink. Shippers, brokers, and carriers alike are left struggling to plan, budget, or price effectively. And despite having more access to data than ever before, many are still relying on incomplete pictures of the market.
Let’s break it down.
We’ve mastered demand.
Freight demand is well-documented and deeply analyzed.
We can track order volumes, e-commerce growth, intermodal activity, and even consumer sentiment. We know when goods need to move — and how quickly.
Over time, freight demand per capita remains relatively stable, even as cycles come and go. The industry has become adept at measuring this side of the equation.
But supply? That’s where the guesswork begins.
Understanding true market capacity — the number of trucks available to move freight — is far more challenging. Yet this is exactly what drives rate pressure.
When too many trucks chase too little freight, rates fall.
When freight outpaces available trucks, rates spike.
It’s classic Econ 101 — but with a missing variable.
For years, the industry has relied heavily on indicators like spot and contract rates from DAT and Cass, or port and rail volumes. These are useful tools — but they are still demand reflections, not supply predictors.
And that’s the blind spot.
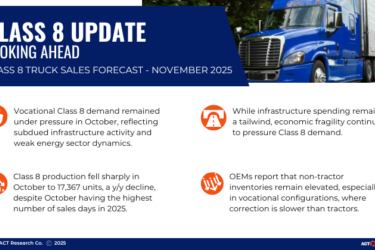
The supply-side solution: Class 8 tractor data.
What’s the most direct way to measure trucking capacity in the U.S.?
Track the build, sale, and deployment of Class 8 tractors.
This data reveals the real-world fleet size — not estimates, not assumptions, but actual capacity in motion. And when overlaid with demand data, it gives you the clearest view possible of where rates are headed next.
At ACT Research, we’ve spent decades refining this model.
By integrating Class 8 tractor data into our freight forecasting, we’ve been able to:
-
Anticipate the 2017 capacity crunch
-
Predict the spot market rollover in mid-2018
-
Forecast 2019 spot truckload rates with 98% accuracy
The difference? A model that considers both supply and demand — not just one or the other.
Why it matters to your business.
If you operate in freight, logistics, or supply chain management, your exposure to rate volatility is constant. Accurate forecasting helps you:
-
Set budgets with greater confidence
-
Lock in more favorable contract terms
-
Improve profit margins
-
Reduce the guesswork in pricing decisions
-
Align staffing and asset strategies with market conditions
Whether you’re a shipper trying to avoid overpaying, or a carrier trying to maintain margins, understanding where the market is going — and why — is mission-critical.
ACT’s freight models bring that clarity.
We don’t just report on trends — we help you anticipate them.
Our models use Class 8 build and sales data to reveal when capacity is entering or leaving the market — and what it means for rate dynamics 6 to 36 months out.
You don’t need another backward-looking index.
You need forward-looking insight that closes the loop between supply, demand, and price.

Showing 1-35 of 35 results
