Booming economic activity results in more freight needing hauled. Freight volume refers to the amount of goods, import and export, moving through the transportation industry. Almost every physical product made or sold in the U.S. economy moves through the commercial vehicle (CV) market.
Why Is Freight Volume Important?
No matter the economic environment, having an understanding of market trends is extremely valuable for companies to be able to respond to challenges and opportunities.
Shippers own or supply the goods (freight) that carriers will transport, and brokers act as the middle man between them; thus, the amount of freight moving among these players will impact how they conduct their business. Businesses benefit from having accurate information related to freight volume so they can better plan for the road ahead.
An effective way to think about supply and demand in the truckload (TL) market is the concept of a pendulum. When demand grows faster than capacity and the supply of drivers or tractors is short, the pendulum swings to the fleets and freight rates rise. When supply growth outpaces demand growth, the pendulum swings to the shipper and freight rates fall. Trying to match long-term businesses with short-term fluctuations in freight demand is cyclical.
How is Freight Volume Measured?
For any company, the scope of internal data can be limiting and unfortunately, the cost of gathering broader market analysis can be prohibitive. As a solution, ACT Research gathers information on a confidential basis from a wide variety of TL carriers, especially the small and mid-size TL carriers that haul a major portion of freight in the North American market. The elements of information include:
- business volume trends,
- market price trends, and
- expectations for vehicle sales and purchases.
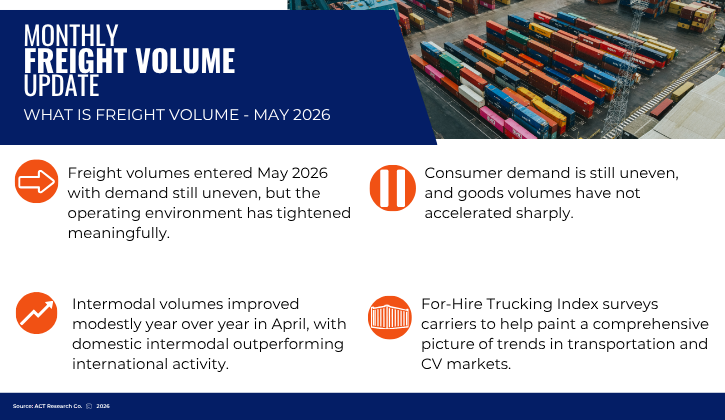
The ACT For-Hire Trucking Index surveys carriers to help paint a comprehensive picture of trends in transportation and CV markets.
Additionally, ACT Research partners with Cass Information Systems, Inc., the nation’s largest processor of freight billing, to gain insight on current market trends and the state of the shipping sector. ACT uses the Cass Freight Index®, which measures freight volumes and expenditures, and the Truckload Linehaul Index®, a pricing indicator, to forecast freight demand.
What is ACT saying right now about freight volume?
Updated Freight Volume Overview – June 2026
Freight volumes entered June 2026 with demand still uneven, but the operating environment has tightened meaningfully. ACT’s latest Freight Forecast indicates that for-hire freight conditions are being shaped less by a broad demand surge and more by capacity contraction, driver availability pressure, and stronger truckload rate conditions. The report’s executive summary notes that for-hire demand creation is being driven by supply contraction, while restocking, lower tariffs, and a broadening industrial rebound are helping offset softer consumer demand.
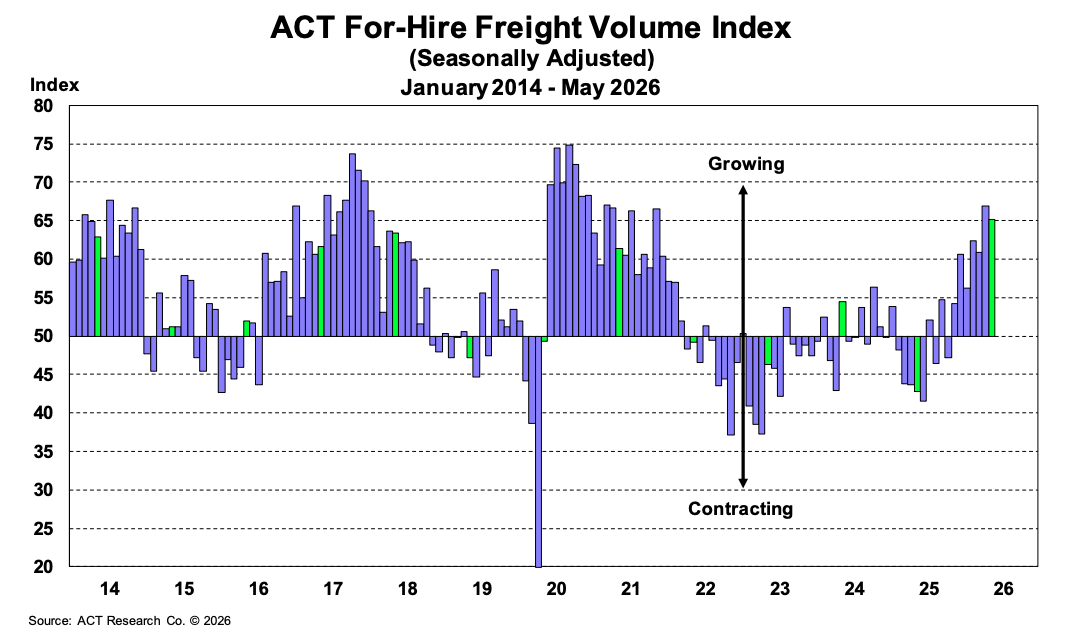
Truckload volumes remain mixed across goods-related freight, but the market is no longer defined by deterioration. ACT’s For-Hire Freight Volume Index eased slightly in May from April’s cycle high, but remained above 60 for the fifth time in six months, a level not reached since late 2021. This matters for shippers, carriers, brokers, and logistics teams because volume trends are now being interpreted through a tighter capacity backdrop, not the oversupplied conditions that shaped much of 2024 and 2025.
Retail-oriented freight remains selective rather than broadly strong. Consumer demand is still uneven, and goods volumes have not accelerated sharply. However, ACT’s June Freight Forecast suggests that capacity reduction is creating for-hire trucking demand even in a sluggish goods economy, while industrial activity is rising, particularly around energy and data centers. From a procurement and routing perspective, shippers should monitor whether tighter truckload availability continues to lift rate floors despite limited demand growth.
Intermodal volumes are one of the clearer bright spots. NA intermodal volumes rose year-over-year in May, accelerated from April, and moved higher again in early June on a seasonally adjusted basis. ACT notes that the tight dry van truckload market and intermodal’s cost advantage are supporting higher volumes, particularly in domestic intermodal, with 2026 volumes on pace to exceed the prior 2018 record.
LTL demand remains in a stabilization phase. ACT’s June Freight Forecast notes that LTL rates are slowing as below-CDL box truck competition rises, but heavier-weight shipments may rebound as truckload capacity tightens. For carriers and shippers, the key signal is whether improving truckload conditions begin to pull more freight into adjacent modes and support broader transportation demand.
Overall, freight volumes are stabilizing rather than broadly accelerating. Demand remains mixed, but tighter driver availability, capacity contraction, and firmer rate conditions are changing the market balance. Shippers, carriers, brokers, fleets, and logistics teams should monitor truckload load postings, intermodal volume trends, LTL shipment activity, private-fleet contraction, and the relationship between modest freight demand and tightening available capacity.
Freight Volume Forecasting
When forecasting the truckload and less-than-truckload markets, ACT Research utilizes two primary metrics to measure industry volumes (demand):
In short, both measure consumer demand that drives the shipping of goods by a carrier. In other words, measurements of the volume of freight hauled.
Cass Freight Index®- Shipments measures the number of freight shipments hauled within North America by Cass Information Systems. Cass processes more than $44 billion in freight transactions annually and is the ideal source for measuring shipper volumes.
ACT Freight Composite Index is a measure of the estimated total freight hauled by sector as developed by ACT Research.
These two demand metrics provide insights into the expected volumes of freight shipped over the next 6-36 months, providing a supply-demand balance when utilized with ACT's capacity (supply) metrics.
To see how freight volume is likely to change in the future, and for detailed analysis and forecasts for truckload, less-than-truckload, and intermodal, see ACT's freight & transportation forecast.